Elements of typography
Typography is the art of arranging type to make written language legible, readable, and appealing when displayed (Wikipedia). However, for the neophyte, typography is mostly apprehended as the juxtaposition of characters displayed on the screen while for the expert, typography means typeface, scripts, unicode, glyphs, ascender, descender, tracking, hinting, kerning, shaping, weight, slant, etc. Typography is actually much more than the mere rendering of glyphs and involves many different concepts. If glyph rendering is an important part of the rendering pipeline as it will be explained below, it is nonetheless important to have a basic understanding of typography. Unfortunately, I cannot write here a full course on typography and I advise the interested reader to read Practical Typography by Matthew Butterick. This open access book introduces the main concepts and give sound advice to improve your written documents.
At this point, you could object that a scientific figure possesses only a few places with written text and it is thus not that important. And yet, it is. Let’s have a look at figure figure-typography-matters that differs only at the typographic level. The top part is the default typographic choices of Matplotlib in terms of font families, slant, weight and size. Those defaults are actually already quite good but can be slightly improved as shown on the bottom figure which was made using different font families (Roboto Condensed and Roboto Slab), size and weights. The difference might appear subtle but is really an important dimension of a scientific figure.
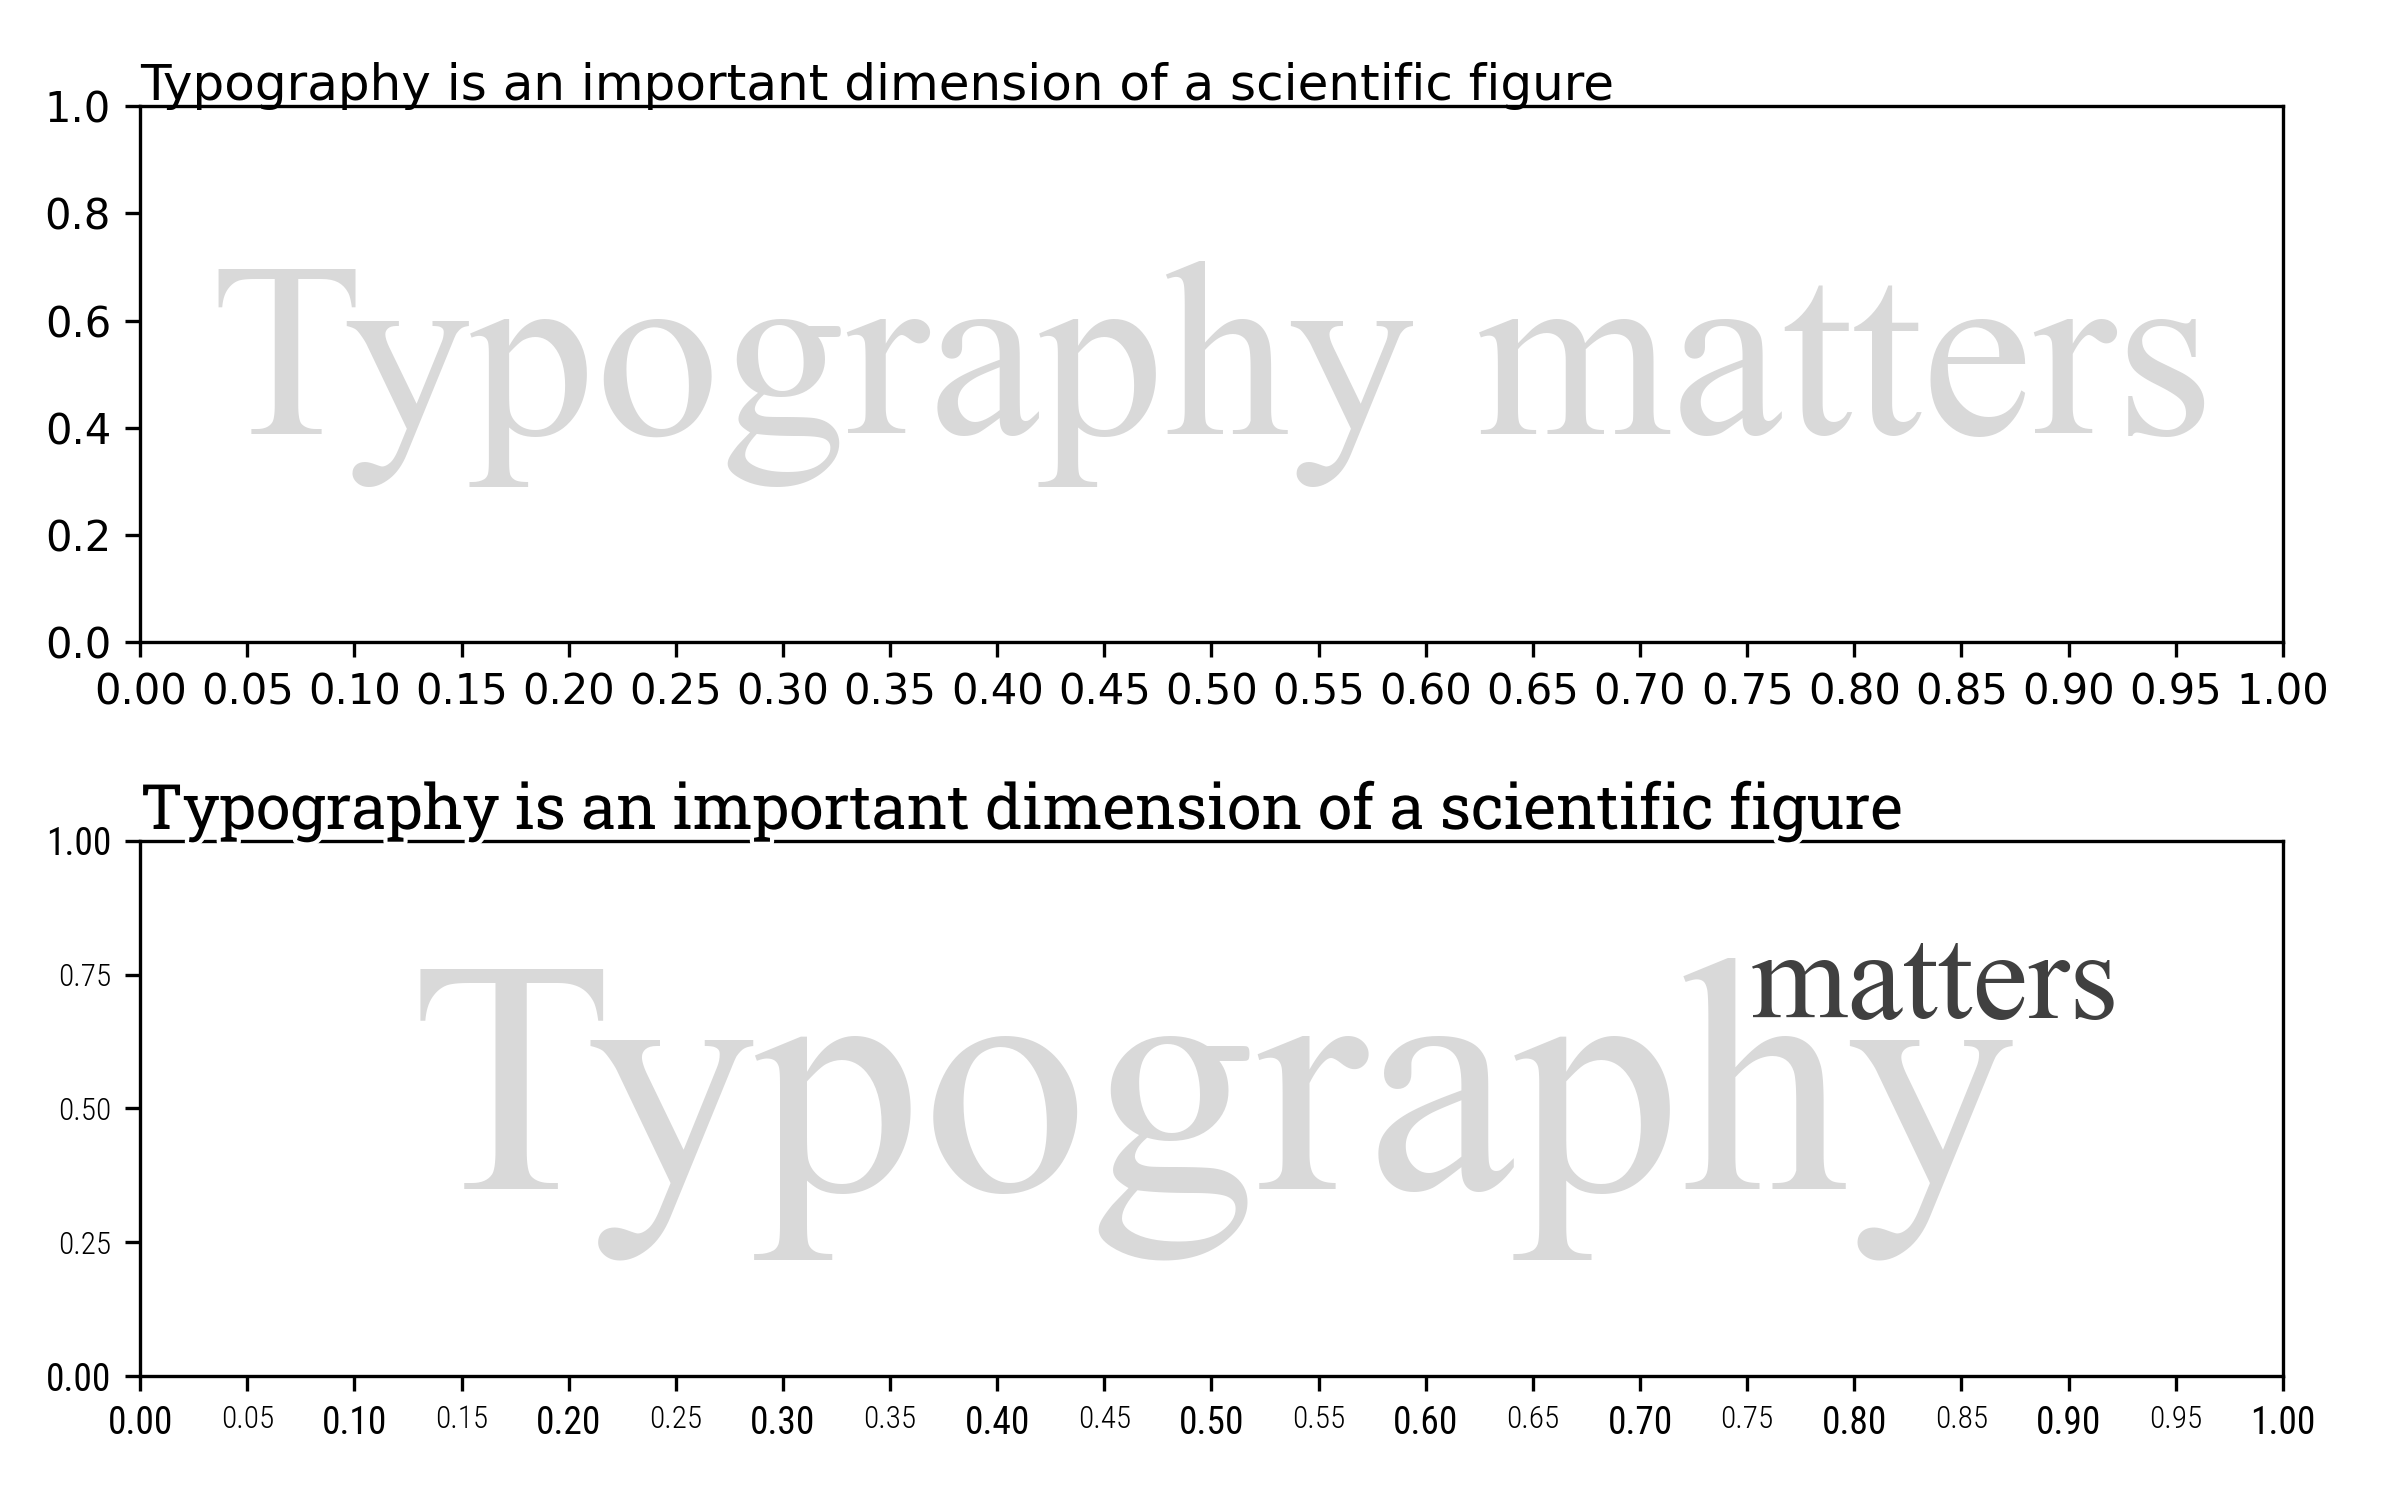
Influence of typography on the perception of a figure figure-typography-matters (sources: typography/typography-matters.py).
Unfortunately, there’s no magical recipe to tell you how to tweak typography for a given figure and it depends on a number of factors over which you have no real control most of the time. For example, consider a figure you make for inclusion in an article that will be published in a scientific journal. These kind of journals possess a template which dictate the future layout of your article (if accepted) as well as a font stack, that is, a choice of fonts for main body, bibliography and peripheral information. If you want your figure to have a good appearance, you’ll need to choose your fonts accordingly. To do that, you can have a look at fonts installed on your system or browse online galleries such as Font squirrel, dafont.com or Google font.
If you install a new font on your system, don’t forget to rebuild the font list cache or Matplotlib will just ignore you newly installed font:
import matplotlib.font_manager
matplotlib.font_manager._rebuild()
Font stacks
The Matplotlib font stack is defined using four different typeface families, namely sans, serif, monospace and cursive. The default font stack is based on the DejaVu fonts that are based on the Bitstream Vera fonts. DejaVu fonts offer good unicode coverage but they come with only two weights (regular and bold) which might be a bit limiting and the project seems to have been abandoned since 2016. The default cursive font is Apple Chancery. Note however that these are only the primary default choices and Matplotlib can fall back to other typefaces if the defaults are not installed. To check which font is actually used, you can type:
from matplotlib.font_manager import findfont, FontProperties
for family in ["serif", "sans", "monospace", "cursive"]:
    font = findfont(FontProperties(family=family))
    print(family, ":" , os.path.basename(font))
You can also design your own font stack by choosing a set of alternative font families. Figure figure-typography-font-stacks shows some alternative font stacks based on the Roboto and Source Pro Family which both have serif, sans and monospace typefaces and comes with several weights.
Font stack alternatives figure-typography-font-stacks (sources: typography/typography-font-stacks.py).
This font stack can be used as the default by modifying either the rc file or the stylesheet (we’ll see that in the section chap-defaults) but you can also use a specific font face for any textual object such as tick labels, legend, figure title, etc. However, for consistency, it’s better to use the same family of fonts (serif, sans and mono) for the whole figure.
Rendering mathematics
The case of mathematical text is slightly more complicated because it requires several different fonts possessing all the necessary mathematical symbols and there are not so many such fonts. Matplotlib offers five different families, namely DejaVu (sans and serif), Styx (sans and serif) and computer modern:
Mathematics font stacks. figure-typography-math-stacks (sources: typography/typography-math-stacks.py).
Matplotlib possesses its own TeX parser and layout engine which is quite capable even though it suffers from some imperfections. For comparison, here is the same mathematical expression as rendered by LaTeX:
We can notice some obvious differences (alignment, weights, line widths). If this is unacceptable for your case, you still have the option to use the real TeX engine by setting the usetex variable:
import matplotlib as mpl
plt.rcParams.update({"text.usetex": True})
A note about size
When you manipulate textual objects you need to specify a size (either explicitly or through the defaults) that is expressed in point (pt). In matplotlib, a point corresponds to 1/72 inches (0.35mm) (while for LaTeX, a point corresponds to 1/72.27 inches). The question is then what does this size measure exactly? It corresponds to 1 em which is a typographic unit and more or less corresponds to a bounding box that can contain any glyphs. No need to say more at this point because the important information is that font sizes are specified in inches and the apparent size is thus directly linked to the resolution of your figure (not the dimension) through the dots per inch (dpi) parameter. You can thus define either a very large or tiny figure, and a font with size 10 will have the same visual aspects on your screen.
Exercise Using different fonts, weights and size, try to reproduce the figure figure-tick-labels-variation.
Tick label variations figure-tick-labels-variation (sources: typography/tick-labels-variation.py).
Legibility
For a traditional document, text is usually rendered in black against a white background that maximizes legibility. The case of scientific visualization is a bit different because there are some situations where you cannot control the background color since it is part of your results.
Typograpy legibility variations. figure-typography-legibility (sources: typography/typography-legibility.py).
This is especially true if you add text over an image such as shown on figure figure-typography-legibility. The first line shows what happens if you add white or black text over a random grey image. The result is nearly impossible to read unless you zoom in. The second line is a bit better thanks to the weight of the font that has been made heavier but the text remains difficult to read. On the third line, I added a semi-transparent background to enhance contrast. This dramatically improves legibility but the result is not really aesthetic and hides a lot of data in the meantime. The best option is shown on the last line where I outlined the font with a thin border. Here the text is legible, aesthetic and does not hide too much data.
Exercise Try to reproduce exactly the figure figure-text-outline which uses the Pacifico font family. Colors come from the magma colormap. Make sure to use different outline widths to get the thin black line between each color.
Text with far too many outlines. figure-text-outline (sources: typography/text-outline.py).
At this point, it is important to understand that Matplotlib offers two types of textual object. The first and most commonly used is the regular Text that is used for labels, titles or annotations. It cannot be heavily transformed and most of the time, the text is rendered following a single direction (e.g.horizontal or vertical) even though it can be freely rotated. There exists however another type of textual object which is the TextPath. Usage is very simple:
from matplotlib.textpath import TextPath
from matplotlib.patches import PathPatch
path = TextPath((0,0), "ABC", size=12)
The result is a path object that can be inserted in a figure
patch = PathPatch(path)
ax.add_artist(patch)
What is really interesting with such path objects is that it can now be transformed at the level of individual vertices composing a glyph as shown on figure figure-typography-text-path.
Better contour labels using text path. figure-typography-text-path (sources: typography/typography-text-path.py).
In this example, I replaced the regular contour labels with text path objects that follow the path. It requires some computations but not that much actually. The result is aesthetically better to me but it must be used wisely. If your contour lines are too small or possess sharp turns, it will make the text unreadable.
Example of 3D text paths. figure-projection-3d-gaussian (sources: typography/projection-3d-gaussian.py).
Another interesting usage of text path is the case of 3D projection as illustrated on figure figure-projection-3d-gaussian. On this figure, I took advantage of the 3D text API to orient and project tick labels and axes titles. Note that such projection is fine as long as the figure is properly oriented. If you rotate, text might be difficult to read and this is the reason why the default for 3d projection is to have text that always face the camera, ensuring legibility.
Exercise Try to reproduce figures figure-text-starwars. A simple compression on X vertices depending on the Y level should work. Vertices of a path can be accessed with path.vertices.
In a far distant galaxy. figure-text-starwars (sources: typography/text-starwars.py).