Introduction
The Python scientific visualisation landscape is huge (see figure fig-landscape). It is composed of a myriad of tools, ranging from the most versatile and widely used down to the more specialised and confidential. Some of these tools are community based while others are developed by companies. Some are made specifically for the web, others are for the desktop only, some deal with 3D and large data, while others target flawless 2D rendering.
Python scientific visualisation landscape in 2018 (not exhaustive). Adapted from the original idea of Jake Vanderplas. Sources: github.com/rougier/python-visualization-landscape fig-landscape
Facing such a large choice, it may be thus difficult to find the package that best suit your needs, simply because you may not even be aware that this or that package exists. To help you in your choice, you can start by asking yourself a few questions:
Do you target desktop or web rendering?
Do you need complex 3D rendering?
Do you need publication quality?
Do you have very large data?
Is there an active community?
Are there documentation and tutorials?
Matplotlib has been originally written by John D. Hunter and the first public version was released in 2003. Michael Droettboom was nominated as matplotlib’s lead developer shortly before John Hunter’s death in August 2012, joined in 2014 by Thomas Caswell who is now (2021) the lead-developer. The latest version is 3.4 (at the time of writing), and is Python 3 only while the 2.2 version is a long term support version compatible with Python 2 and Python 3. Sources: introduction/matplotlib-timeline.py fig-matplotlib-timeline.
Depending on your answers, you may be able to decide which package to use and to invest some time learning it. For example, if you need interactive visualization in the browser with seamless integration with jupyter, bokeh might be an answer. If you have very large data and needs 3D on the desktop, vispy or mayavi might be an option. If you’re interested in a very intuitive tool to rapidly build beautiful figures, then seaborn and altair are your friends. However, if you’re working in geosciences, then you cannot overlook cartopy, etc. I cannot list them all and I’m sure that between the writing of this chapter and the actual publication of the book, new visualization libraries will have been created. A good source of information is the pyviz website (Python tools for data visualization) that offers a lot of pointers and has an up-to-date list of active packages (as opposed to dormant).
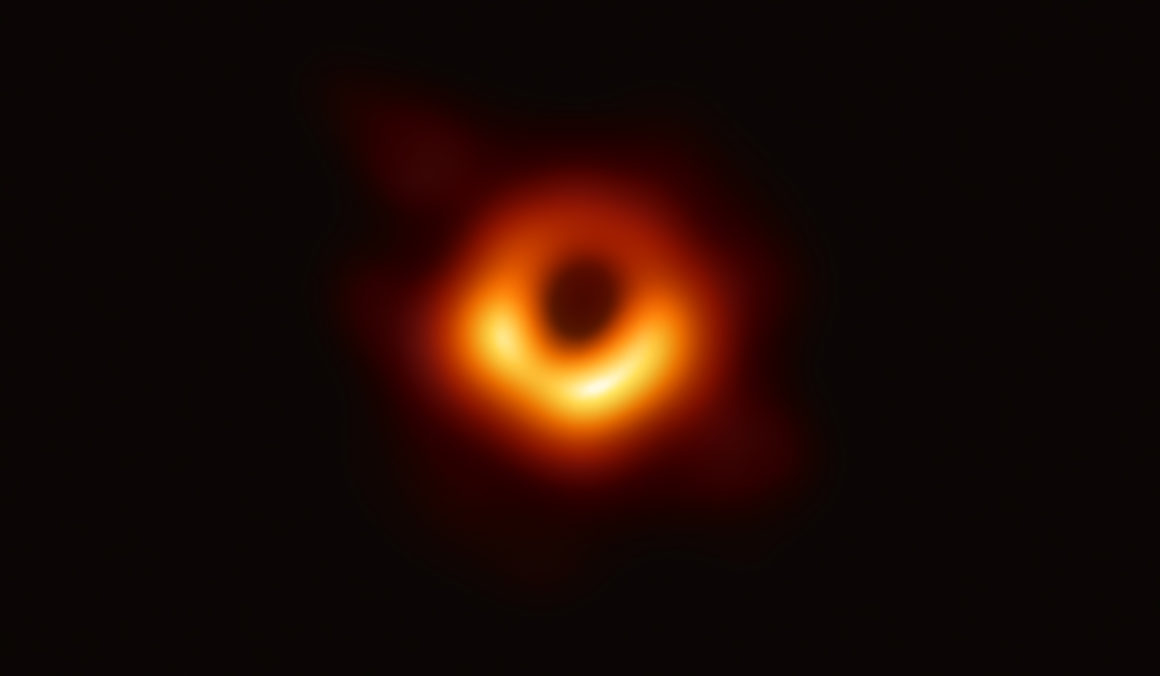
The supermassive black hole at the core of supergiant elliptical galaxy Messier 87, with a mass ~7 billion times the Sun’s, as depicted in the first image released by the Event Horizon Telescope (10 April 2019). Source: Wikipedia fig-black-hole
In this landscape, Matplotlib has a very special place. It was originally created by John D. Hunter in 2003 in order to visualize electrocorticography data. Here is the official announcement posted on the Python mailing list on May 23, 2003 1.
- 1
Many thanks to Anthony Lee for pointing me to this archive.
Matplotlib

  Matplotlib is a pure python plotting package for python and
  pygtk. My goal is to make high quality, publication quality
  plotting easy in python, with a syntax familiar to matlab
  users. matplotlib is young, and several things need to be
  done for this goal is achieved. But it works well enough to
  make nice, simple plots.

Requirements

  python 2.2, GTK2, pygtk-1.99.x, and Numeric.

Download

  See the homepage - nitace.bsd.uchicago.edu:8080/matplotlib

Here are some of the things that matplotlib tries to do well

* Allow easy navigation of large data sets. Right click on
  figure window to bring up navigation tool bar for pan and
  zoom of x and y axes. This requires a wheel mouse. Place
  the wheel mouse over the navigation buttons and scroll away.
* Handle very large data sets efficiently by making use of
  Numeric clipping. I have used matplotlib in an EEG
  plotting application with 128 channels and several
  minutes of data sampled at 400Hz, eg, plotting matrices
  with dimensions 120,000 x 128.
* Choose tick marks and labels intelligently
* make easy things easy (subplots, linestyles, colors)
* make hard things possible (OO interface for full control)

Matplotlib is a class library that can be used to make plots
in pygtk applications. But there is a matlab functional
compatibility interface that you can get with, eg::

  from matplotlib.matlab import plot, subplot, show, gca

Example scripts and screenshots available at
http://nitace.bsd.uchicago.edu:8080/matplotlib

John Hunter
The initial goal was to replace the popular Matlab graphics engine and to support different platforms, to have high quality raster and vector output, to provide support for mathematical expressions and to work interactively from the shell. The first official release was made in 2003 (see figure fig-matplotlib-timeline) and more than 15 years later, the initial goals remains the same even though they have been further developed and polished. Today, the Matplotlib library is a de facto standard for Python scientific visualization. It has, for example, been used to display the first ever photography of a black hole (see figure fig-black-hole) and to illustrate the existence of gravitational waves. Matplotlib is both a versatile and powerful library that allows you to design very high quality figures, suitable for scientific publishing. It offers both a simple and intuitive interface (pyplot) as well as an object oriented architecture that allows you to tweak anything within a figure. Note that, it can also be used as a regular graphic library in order to design non-scientific figures, as we’ll see throughout this book. For example, the Matplotlib timeline figure (see figure fig-matplotlib-timeline) is simply made of a line with markers and some styled annotations.
This book is organized into 4 parts. The first part considers the fundamental principles of the Matplotlib library. This includes reviewing the different parts that constitute a figure, the different coordinate systems, the available scales and projections, and we’ll also introduce a few concepts related to typography and colors. The second part is dedicated to the actual design of a figure. After introducing some simple rules for generating better figures, we’ll then go on to explain the Matplotlib defaults and styling system before diving on into figure layout organization. We’ll then explore the different types of plot available and see how a figure can be ornamented with different elements. The third part is dedicated to more advanced concepts, namely 3D figures, optimization, animation and toolkits. Lastly, the fourth and final part is a collection of showcases and their analysis.